The Faculty/PI Dashboard in FinHub
The Faculty/PI Dashboard Reports in FinHub give Principal Investigators and Co-Principal Investigators a centralized view of their research funding and financial resources. These personalized, view-only reports include all awards and projects where you are listed as PI or Co-PI, providing a comprehensive look at your research portfolio in one place.
- 🔍 View all your research funds in one place
- 💡 Drill into details by award or project
- 🧾 Includes both Sponsored Awards and Faculty Funds
Faculty / PI Dashboard Reports
Faculty Resources
- FinHub Glossary/Terminology
- FinHub Navigation
- Faculty/PI Dashboard Kickoff Meeting (Video Recording - Approx 28 min)
Guides to Reports (Coming Soon)
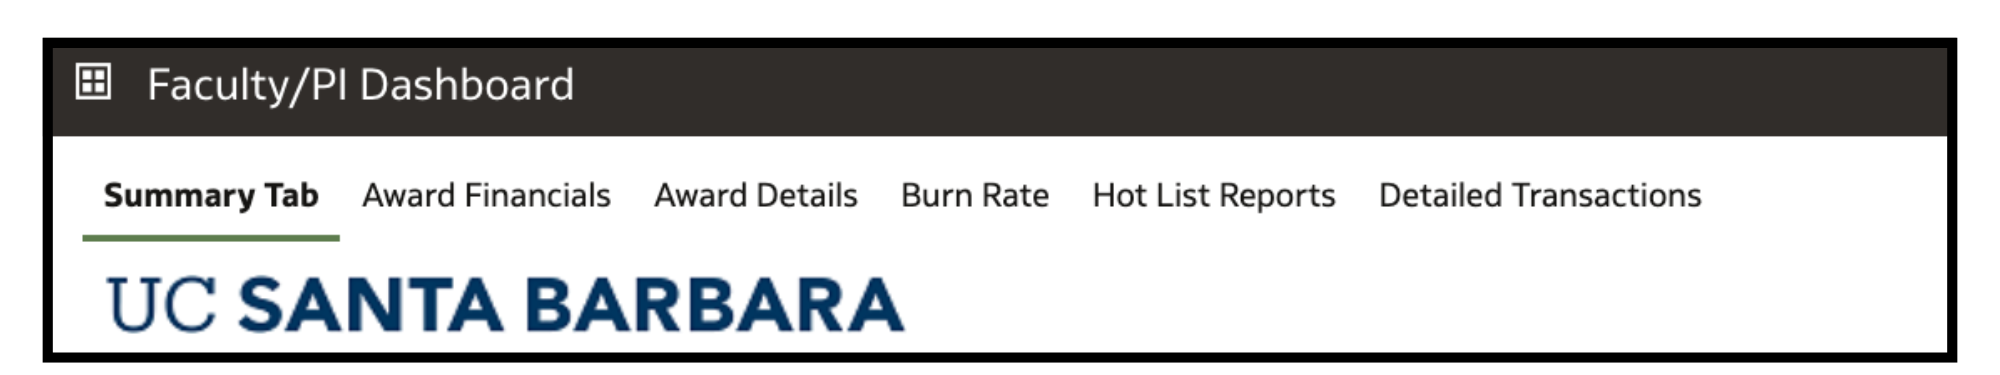
Main Tabs in the Dashboard
Below is an example of the main tabs in the Dashboard.
Navigation Overview
Across the top of the dashboard, tabs and sub-tabs help you navigate between reports and drill down into details. Filters and custom views allow you to refine the data as needed. At the top of most reports, you’ll see filters that allow you to refine the data. These filters can be saved as customizations for future use, so you can quickly return to frequently used views.
Most reports offer multiple views:
- Summary view provides high-level insights.
- Detail view displays additional fields for a more in-depth look at the data.
The dashboard is designed to present the most important information up front, with the ability to drill down further as needed.
Note: The dashboard is view-only. No data entry is required or permitted. All navigation is done using the tabs across the top. When you open a drill report, it will appear in a new window. Simply close that window when you're done to return to the main dashboard.
Summary Tab Report
This is your launch point. It provides a high-level overview of your active awards, available balances, and quick links to detail and financial reports.
At the top of the summary screen, you’ll see several info boxes showing:
- The number of awards and projects in your portfolio
- The total budget amount
- The remaining balance
Clicking on any of these boxes will drill down to a corresponding detailed report.
Below that, you’ll find two important graphs:
- On the left, you’ll see the Current Sponsored Award Balance Report, which displays award budget amount, award expense amount, and the award remaining balance.
- On the right, you’ll find the Current Faculty Funds Balance Report showing similar financial data.
Clicking on an award number in these graphs will drill down to a financial report, showing:
- Award balances by expenditure category
- Associated project financials
- Scrolling further down the summary page, you’ll also see visual summaries like Budget by Sponsor and Balance by Project Type — helpful for getting a quick overview of your award and project portfolio.
| Tab | Reports |
|---|---|
| Summary Tab | Summary Tab |
| Award Financials | Award Financials |
| Project Financials | |
| Financials by Fund | |
| Award Future Funding | |
| Award Details | Award Details |
| Project Details | |
| Burn Rate | Burn Rate |
| Hot List Reports | Projects Ending Soon |
| Projects in Overdraft | |
| Detailed Transactions | Detailed Transactions |
FAQs
What if I don’t see my awards?
Contact your Research Financial Analyst or Faculty Funds Project Analyst to ensure your PI or Co-PI role is correctly listed in the Projects and Grants Management Module.
Can I export data?
The dashboard is view-only, but you can export specific reports through the FinHub reporting interface.
Need Help?
If you have questions or need assistance using the dashboard, please use our feedback form.
Subscribe to our email list to automatically receive updates when new content is added!
Contact Us